
The pressure sensors developed in the SocketSense project thus far are in the form of strips consisting of several sensing elements (sensels), an example is shown in Figure 1. Due to hardware limitations, the system can connect up to five sensor strips with eight sensels per strip. It is therefore important to identify which regions on the residual limb are most important for socket fit and socket comfort. The strips can then be positioned in the socket accordingly.
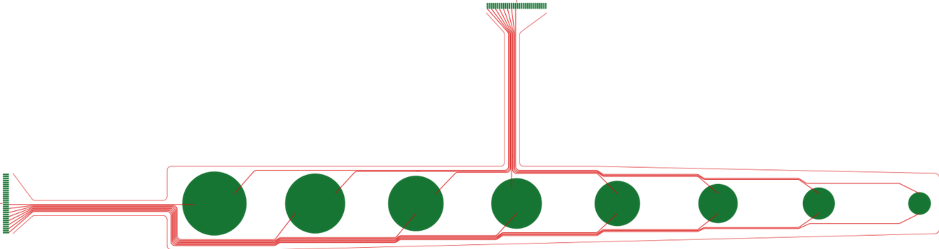
Figure 1. Example of the sensor strip. Round dots represent sensels and the red lines are conductive tracks.
A literature study found a publication by Neumann et al., (1), whereby the pressures exhibited on the residual limb of a single transfemoral amputee during normal gait was acquired using the F-Socket system, (Tekscan, Inc., South Boston, MA). The pressure data was presented with reference to the stump anatomy. This visualisation method was developed, and a 2D pressure map of the socket generated to aid sensor strip design and strip configuration in the socket in the SocketSense project.
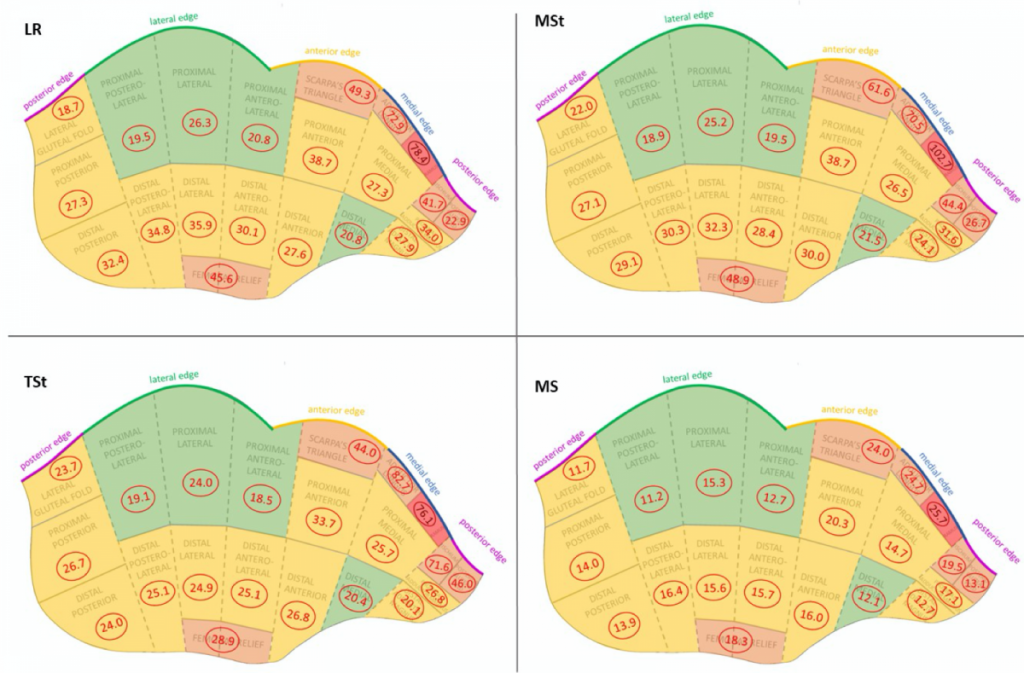
A 3D model of an ischial containment socket was flattened into a 2D map which was segmented into regions reflecting the residual limb anatomy. Four maps were generated (Figure 2), each representing a different phase of the gait cycle: 1) loading response (LR); 2) mid-stance (MSt); 3) terminal stance (TSt); 4) mid-swing (MS). The pressure values within each region are presented for that instance in the gait cycle. The regions are colour-coded based on the magnitude of pressure variation throughout the gait cycle; red indicates a large pressure variation, orange regions undergo moderate variations, yellow present little variation, and areas with minimal changes are shown in green. Noting the pressure variations throughout the gait cycle is important to ensure no region is overlooked.
The data presented in the pressure maps were extracted from a journal article by Neumann et al., 2005 (1). Additionally, the anatomical regions depicted are in accordance with those defined in the same article. The 3D model of an ischial containment socket obtained from an online CAD repository (https://www.thingiverse.com/thing:3231852/files, (2)), which was converted into a 2D map using Solidworks.
The maps provide visualisation of key regions of interest where the sensor strips may be positioned, which in turn aided the development of sensor strip design. Sensor strip design involves both the materials selection, circuit routing, as well as sensel configuration, sensel geometry and overall strip geometry.
References
1. Concepts of Pressure in an Ischial Containment Socket: Measurement. Neumann, Edward S., Wong, Jocelyn S. and Drollinger, Robert L. 1, Las Vegas : JPO Journal of Prosthetics and Orthotics, 2005, Vol. 17.
2. Transfemoral (above-knee) Ischial Containment Prosthetic Socket Pack 1 by MakisB – Thingiverse. Thingiverse. [Online] 2018. https://www.thingiverse.com/thing:3231852/files.